
Global M&A market
In this video we consider the recent history of global M&A business leading up to the financial crisis and what followed. Jeff outlines the prominence of M&A deals in the global economy, what factors influence buyers selling their stock and what kinds of mergers are found.
Here is a snapshot of some facts and figures relevant to the US and global M&A markets that are presented in the video.
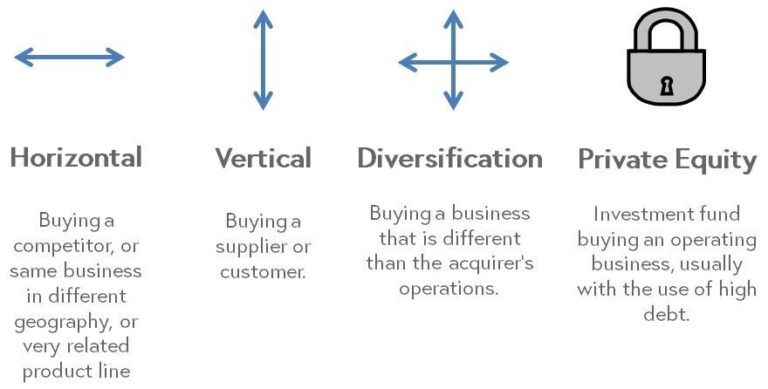
Types of merger
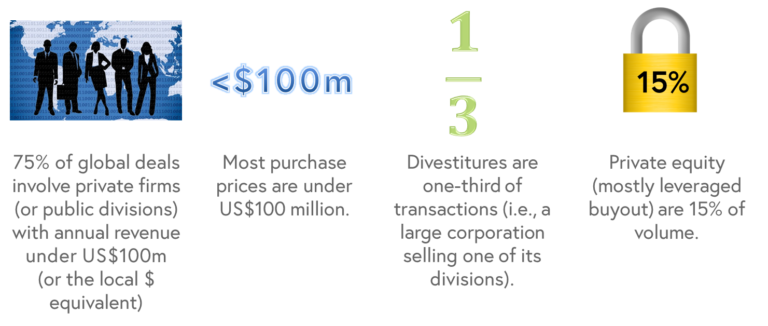
M&A facts
M&A volume in four global areas

What investment banks are advisors?
| Worldwide | Asia-Pacific (exc. Japan) | Japan |
|---|---|---|
| Global | UBS | Nomura |
| Morgan Stanley | Macquarie Bank | Mizuho |
| Goldman | Citigroup | GCA |
| Citigroup | Morgan Stanley | Citigroup (US) |
| JP Morgan | Goldman Sachs | Merrill Lynch (US) |
| Merrill Lynch | Daiwa | |
| HSBC (No Korean / Japanese / Chinese) |
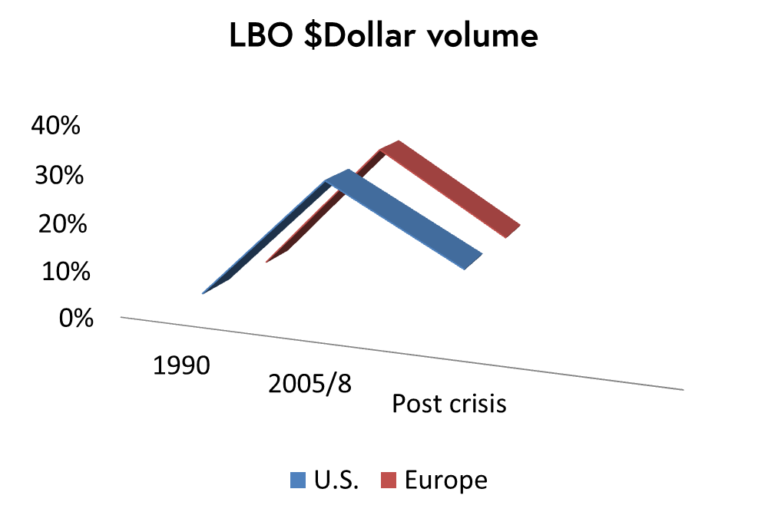
Leverage buyout volume decline after financial crisis
| LBO dollar volume | 1990 | 2005/8 | Post crisis |
|---|---|---|---|
| US | 4% | 30% | 15% |
| Europe | 3% | 31% | 14% |
On the bottom of each article and video step you will find a PDF available to download in the ‘downloads’ section. Each of these contain important information presented throughout the course and can be used as a revision guide.
Discussion
Studies prove that large acquisitions are not guaranteed to increase the stock price of the buyer. 50% fail to do that. Why do you think this is?
Mergers and Acquisitions: Concepts and Theories


Mergers and Acquisitions: Concepts and Theories
Reach your personal and professional goals
Unlock access to hundreds of expert online courses and degrees from top universities and educators to gain accredited qualifications and professional CV-building certificates.
Join over 18 million learners to launch, switch or build upon your career, all at your own pace, across a wide range of topic areas.

